See every dollar.
Know where it came from.
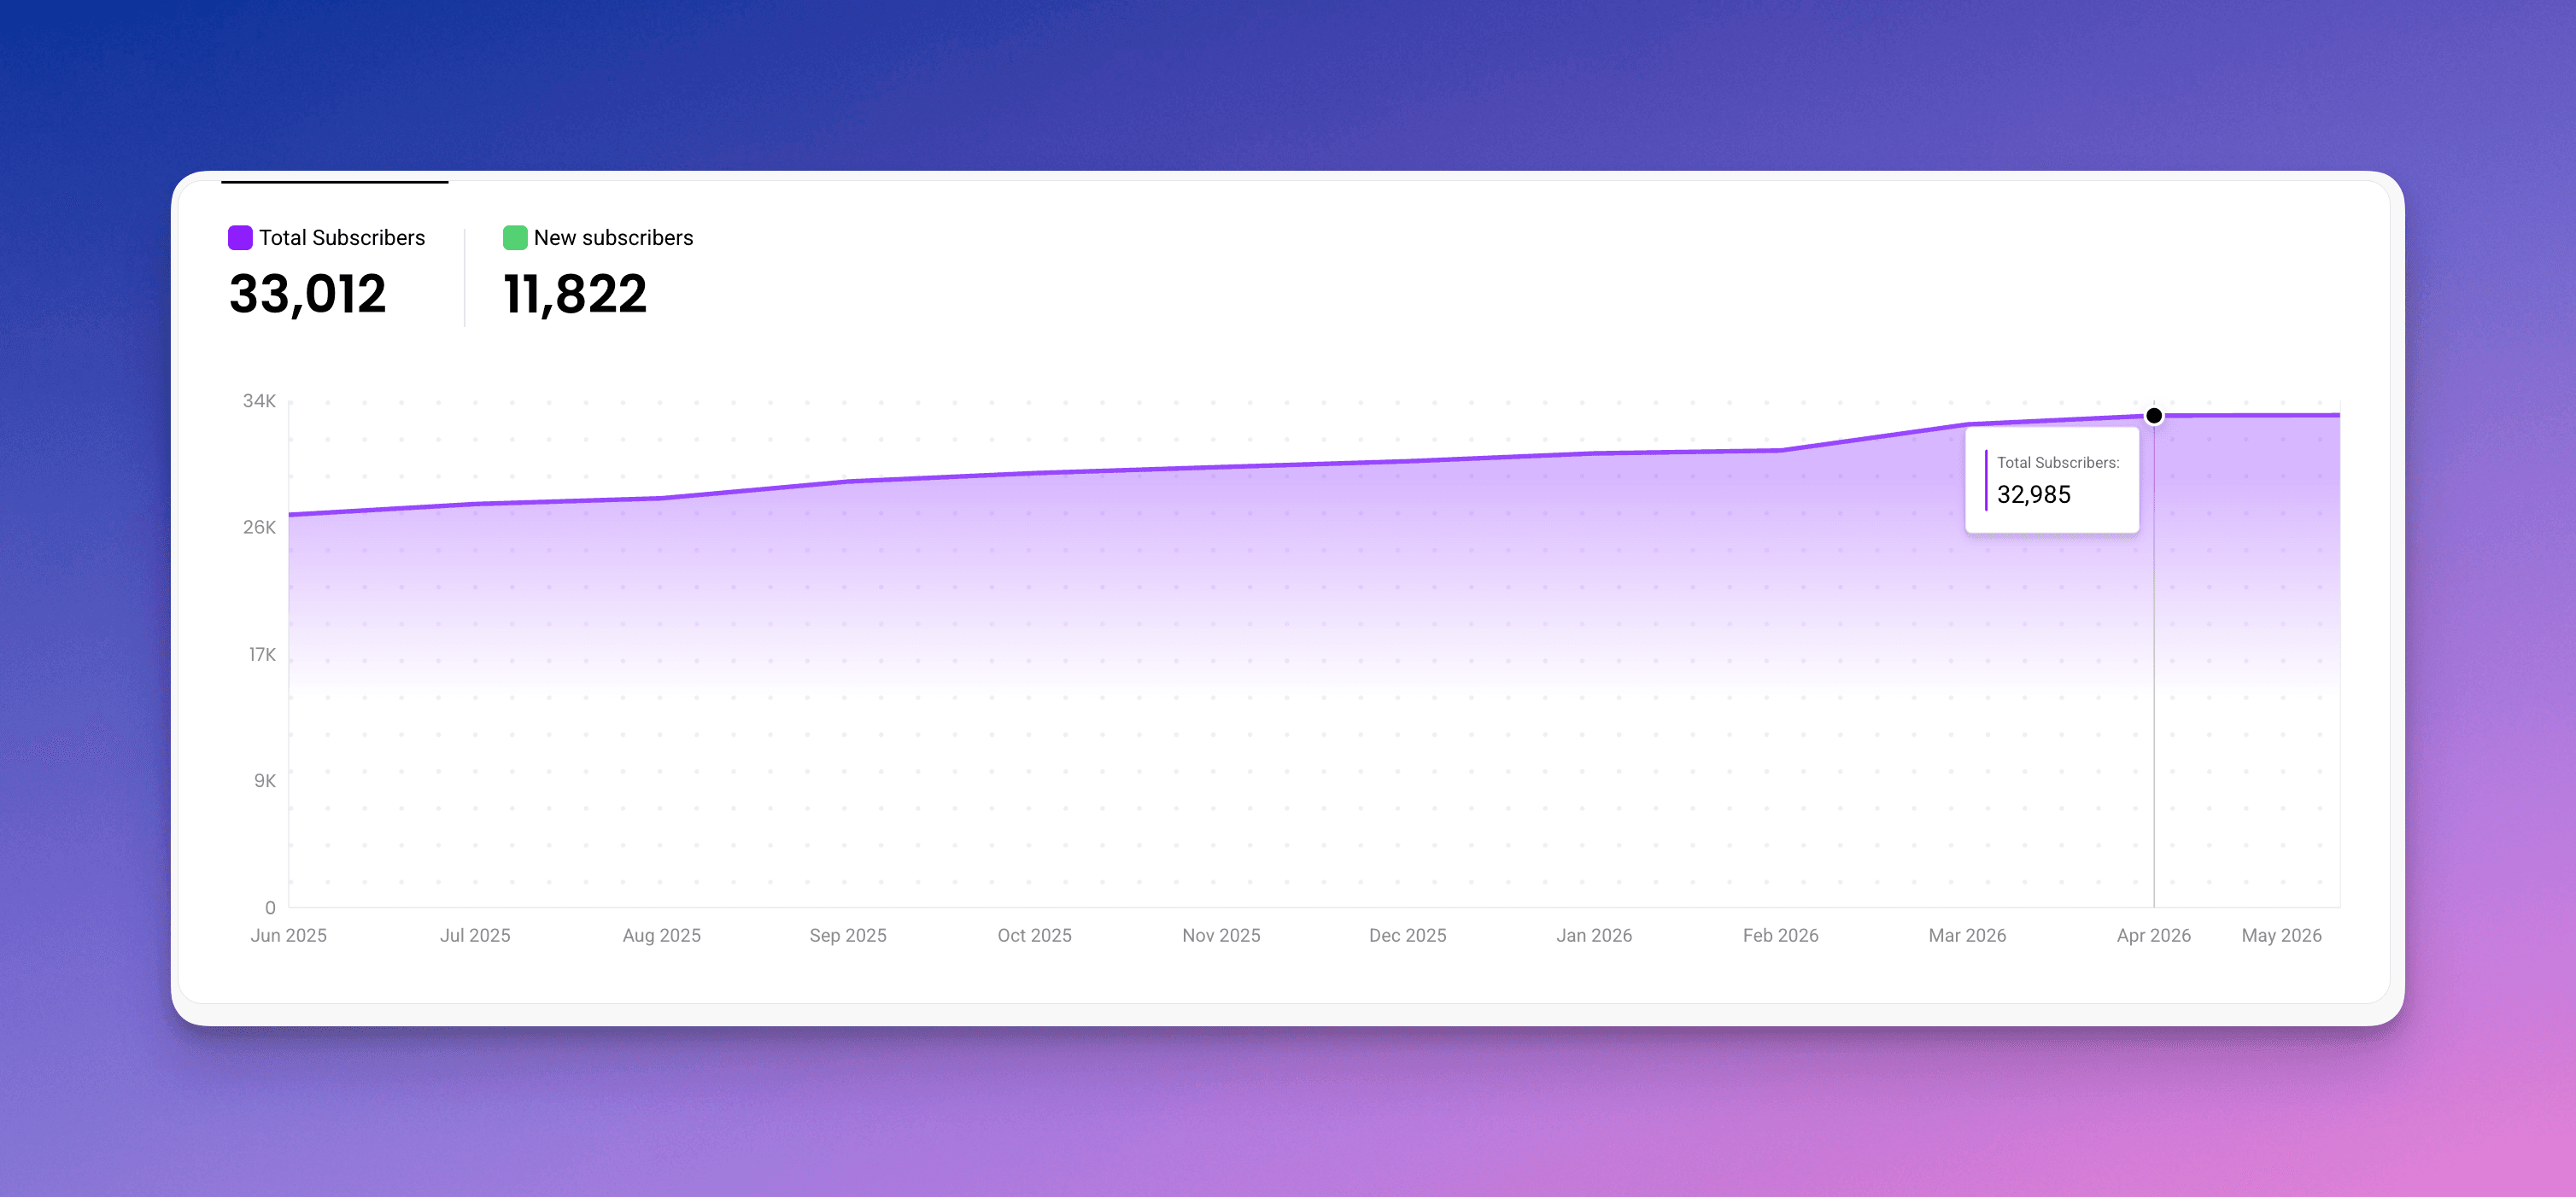
The Insights page is rebuilt. Facebook revenue, Instagram revenue, challenge outcomes, and your full subscriber picture — all in one place, all in real time.
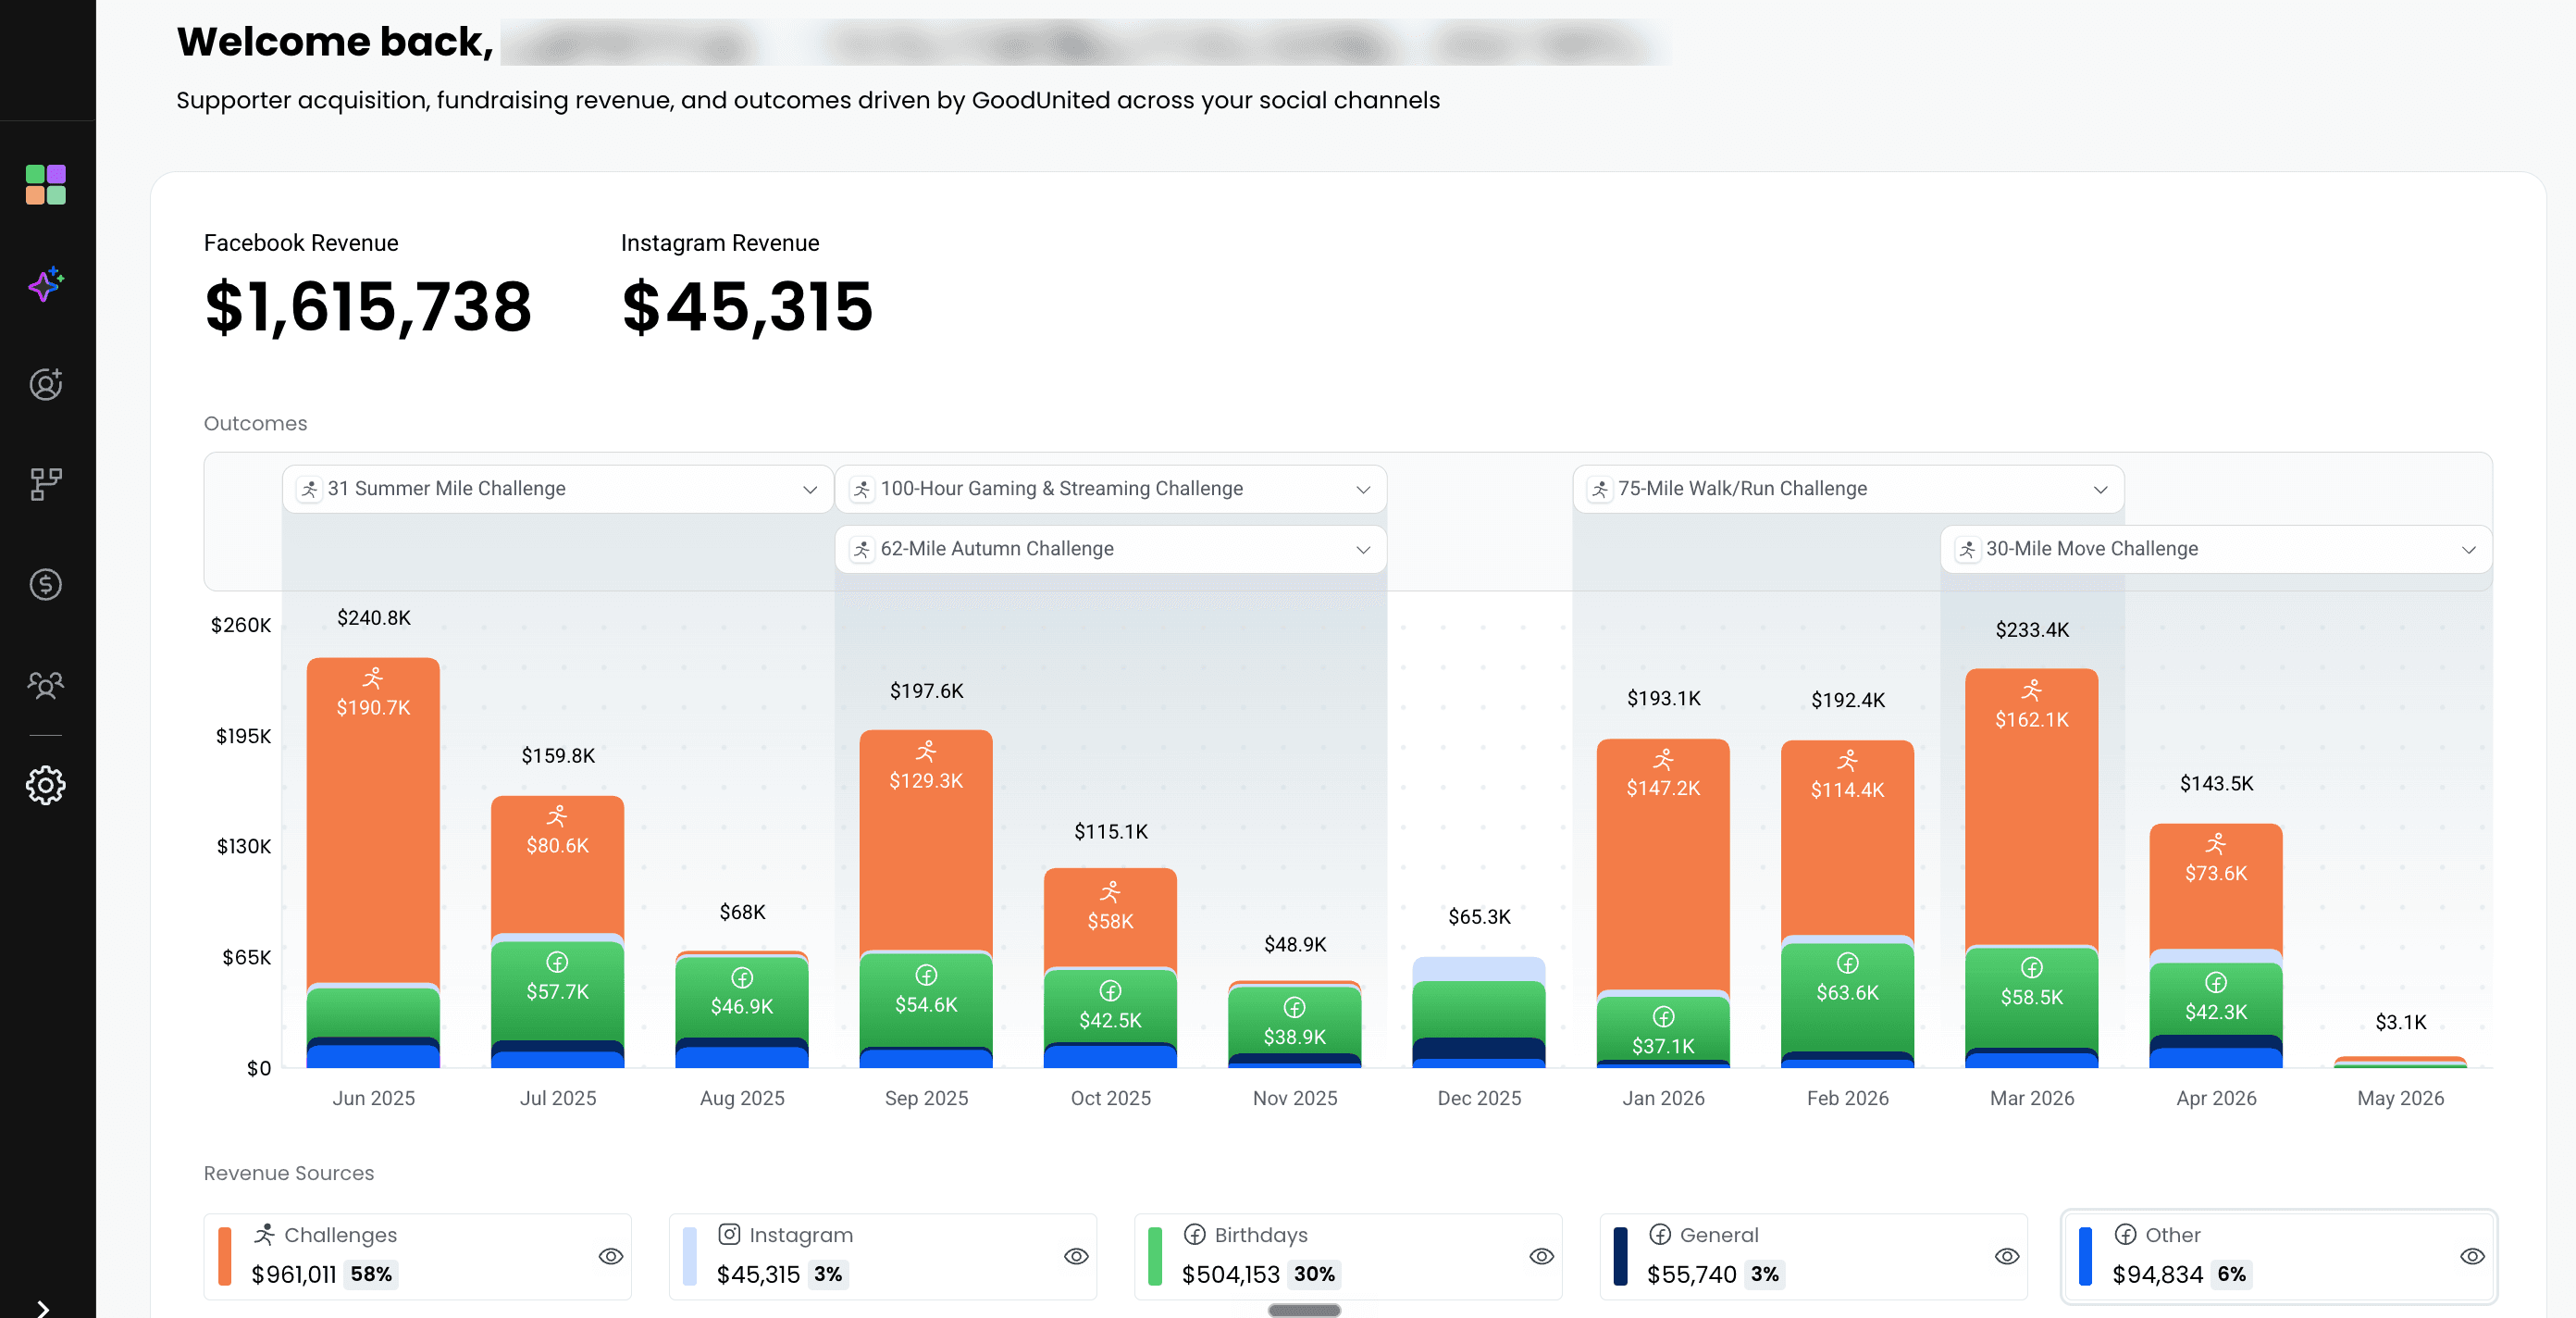
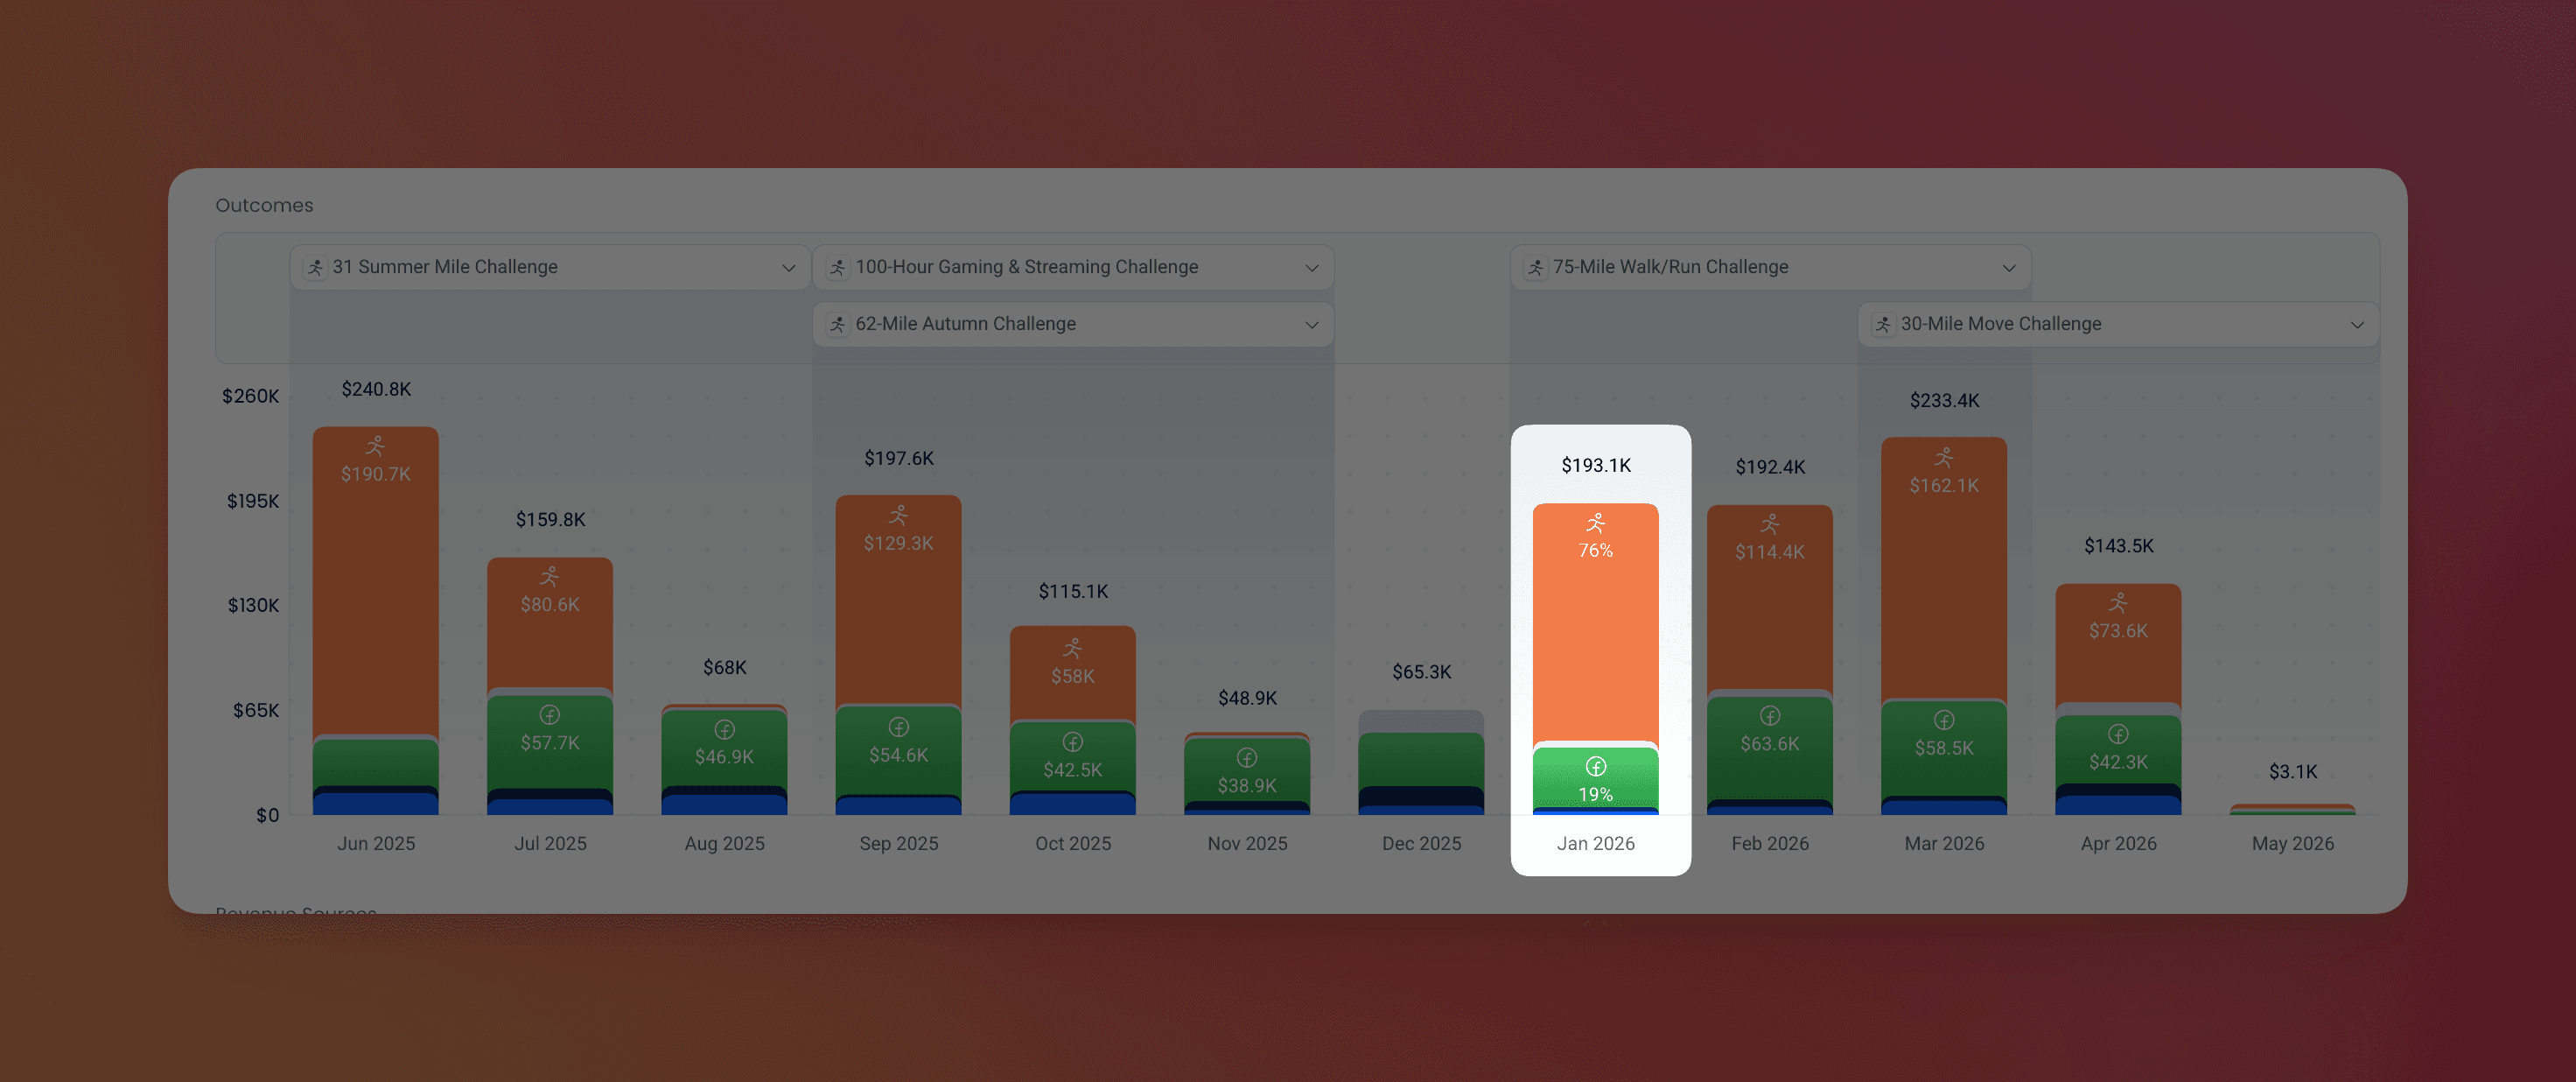
Insights, with both revenue streams and the outcomes chart in view.
A closer look
Two changes that reshape how you'll use Insights day to day — challenge drill-downs, and a real picture of where Facebook revenue actually comes from.
From challenge results to supporters — in two clicks.
Every challenge on the Outcomes chart is now expandable. Click any challenge to see total revenue, number of participants, and how many converted to Messenger subscribers. Then click into the supporter view for a ranked list of every participant — name, subscriber status, and amount raised. When you're ready, hit Export to pull the whole list.
See what's actually driving your Facebook revenue.
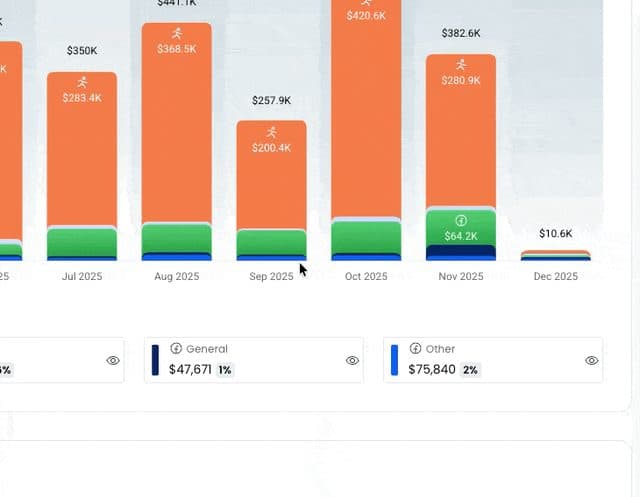
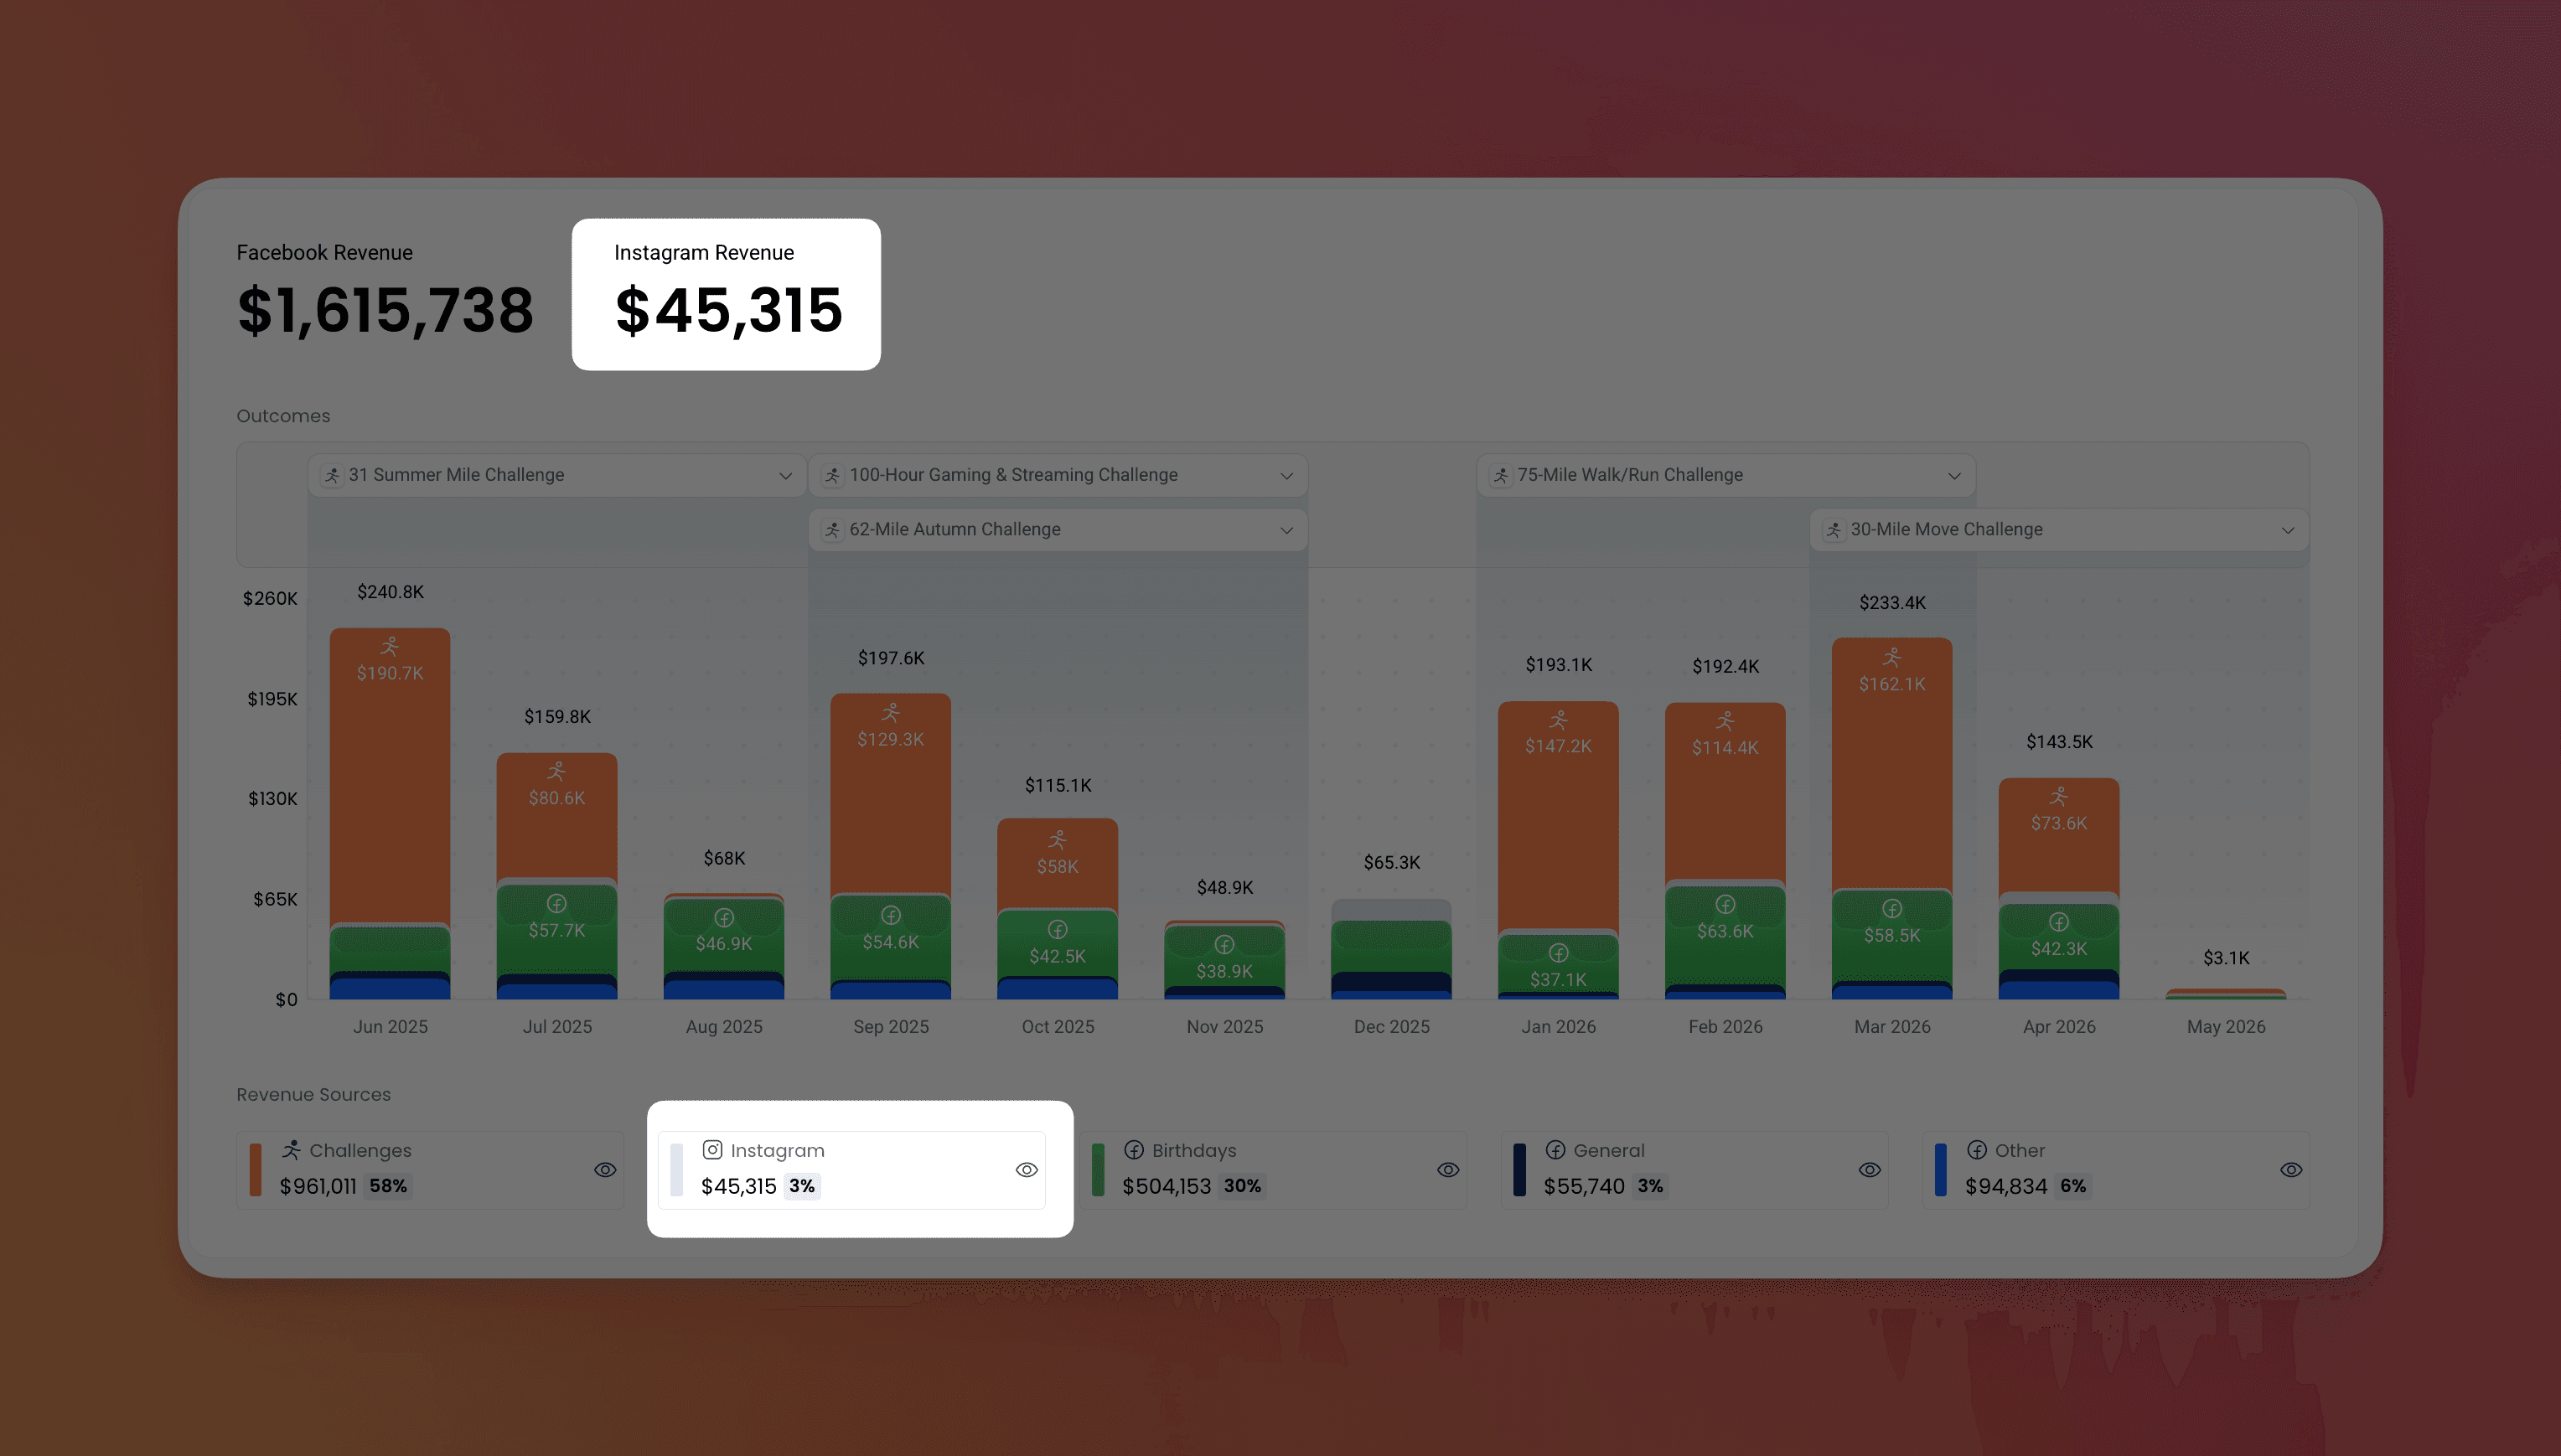
Below the outcomes chart, Revenue Sources breaks your total Facebook fundraising into five streams: Challenges, Birthdays, Instagram, General, and Other — each with a dollar amount and percentage of total. Toggle any source on or off to isolate it in the chart.
The numbers that matter, ready before your board asks.
Three smaller things
Refinements throughout the page that add up.
One Last Thing
This is just the starting point. The Insights page today covers Facebook and Instagram revenue, challenge outcomes, and subscriber growth.
We're not done. Additional GoodUnited outcomes are coming soon — more ways to see what your campaigns are producing, who your best supporters are, and where to focus next. Stay tuned.